
Rate Limiting at Close
Our REST API is a critical part of our service that enables customers to build sophisticated integrations to our CRM. As the number of API users increased, we experienced more and more situations where we wished we could limit the rate they accessed it. As it turns out, what started out as a quick fix to control access to our API evolved into flexible approach to rate limit many processes across our stack.
API Rate Limits
It had become too easy for a customer to write an integration script that hit our API many times per second. Container technologies like Mesos and Kubernetes have made it easy for customers to scale workers to the point they would “attack” our infrastructure. Without some controls, one customer could adversely impact others and slow down our entire infrastructure.
So, in early 2017 we implemented our first version of API rate limiting. It was
pretty simple, just a Redis LUA script to keep a counter of requests per API key
and a hard expiration timer on the counter using the built in
TTL capabilities of Redis. The LUA script
followed the Rate limiter pattern described in the
Redis docs. The only
trick is to make sure the TTL is reliably set once so the key expires and resets
the counter to 0. This can be guaranteed by placing the incr and expire
commands in the same script like this:
local current_count
current_count = redis.call("incr",KEYS[1])
if tonumber(current_count) == 1 then
    redis.call("expire",KEYS[1],ARGV[1])
end
return current_count
Our Python Flask app simply checked the returned count to see if it was over the
threshold, if so it returned a
429 to the customer. From the
beginning we decided to limit requests per API key and endpoint group. An
endpoint group is defined by the URL prefix and request method. So for instance,
we might allow 40 requests per second (RPS) for POSTs to any endpoint starting
with /api/v1/lead/ but only allow 10 RPS for GETs to /api/v1/report since
those requests potentially require more processing resources. The Redis key for
a single rate limit counter consists of the API key identifier and the API
endpoint group URL prefix. This gives us the flexibility to adjust access rates
based on potential impact of a set of API endpoints. Our goal was always to
provide the highest practical limit as possible for our customers. We
immediately realized the benefit of being able to control rogue request
patterns.
In March 2017 we ran across Stripe’s blog post discussing their implementation and usage of the token bucket algorithm for rate limiting. We might have started with a simple implementation, but we likely would need capabilities like bursting and varying time windows in the future. So, instead of building on our first implementation (and to avoid NIH Syndrome) we implemented a token bucket algorithm in Redis as the foundation of our rate limiting. The majority of this was written as a Lua script.
With our rate limits in place, we thought we were good — until some of our customers realized rate limits were per api key. At least one customer round robin-ed key usage so they could increase their access rates by 10x. What was the solution? More rate limiting! We implemented an additional customer-wide rate limit of 3x an API key’s limit. This allows the customer to manage how they use our API, effectively being able to use 3 API keys at their maximum rate or 30 keys with each using a small percentage of the limit but can burst as needed. At this point we had a pretty effective API rate limiting implementation. We made a few more tweaks along the way but the core hasn’t changed. The current details are available in our developer docs.
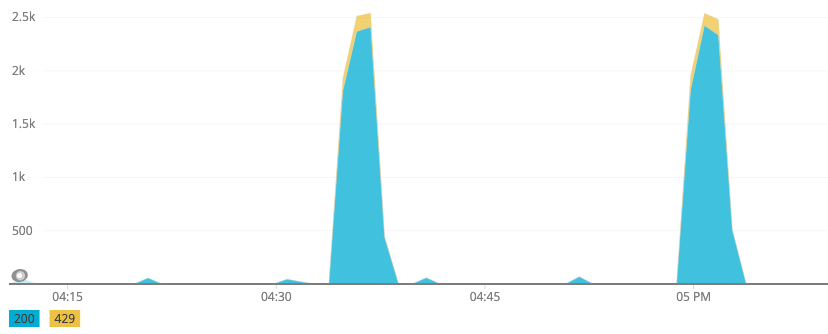
The following graph is an example of a typical rate limited access pattern. The
Y axis is the count of 200 and 429 responses per minute for one API key. The
requests quickly jump up to the maximum rate of 2,400 RPM (40 RPS) and then
start getting 429 rate limit responses. The yellow 429 “snow caps” on the
large blue 200 spikes suggest a well behaved client script that backs off when
it sees it has hit the limit. This also looks like it roughly triggers every 30
minutes so it is likely something like a cronjob that may cycle like this 24
hours a day.
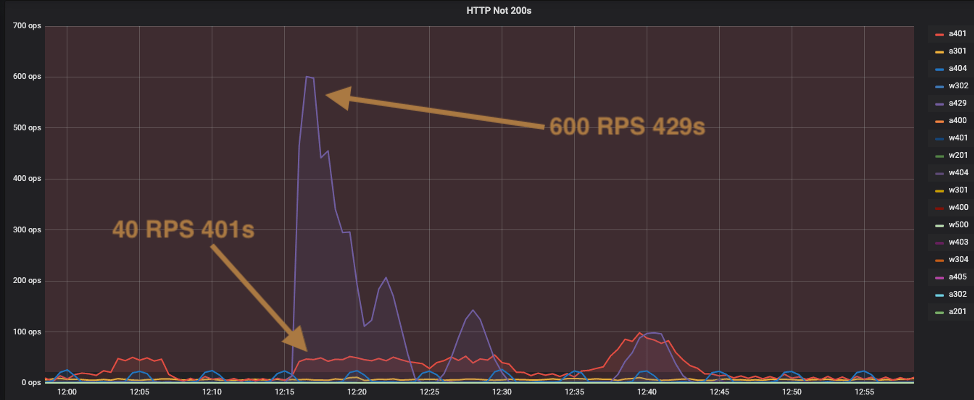
The next graph is an example of a misbehaving client integration using an
invalid API key. You can see the red 401s come up to about 40 RPS (ops Y
axis) and then the large spike up to 600 RPS for 429s. The integration script
is most likely retrying immediately on errors (e.g. 4XX responses) and
ignoring the rate_reset value in the 429 response that indicates how long
they should wait before making another request.
In this case there is limited impact to our infrastructure because most of the
processing is done in a dedicated Redis instance and the app servers can quickly
return the 429s once it gets the limit response from Redis. Of course we
rather customers stop trying to use deactivated API keys but that is separate
challenge.
Internal rate limiting
It turns out customers aren’t the only ones who can quickly scale and “attack” our infrastructure — we can do it to! Modern email providers like Mailgun can easily deliver a large batch of these emails in a very short time. Each email a customer gets is processed by the Close platform to add metadata, make it searchable, etc. This type of processing is done in a background task, which should ideally be handled at a lower priority relative to more critical workflows (like serving web requests).
Some basic refactoring of our API rate limiting logic allowed us to pull out a pretty generic rate limiting implementation. We called them Throttles and quickly started using them in several spots to control processing rates. The RPS, window and token request for each Throttle could be overridden by keys in Redis so we could tune each process on the fly and ramp them up/down as needed. We call the settings Knobs since they let us dial in the processing rates we want. So in the email processing case from earlier, we simply added a Throttle and tuned in the rate that kept any backend data stores from becoming overloaded.
As we started needing Throttles in more places, we pulled the core logic out and
published it as LimitLion. One of our
most recent uses was to solve an issue related to our recently shipped
calendar syncing feature.
Google calendars can be watched so that notifications are sent to a HTTP
endpoint if anything has changed. Simple enough but it turns out Google doesn’t
rate limit or even de-dupe these notifications which can result in a huge burst
of notifications for the same calendar. To protect the underlying MySQL database
we added a LimitLion throttle to the existing
Nylas endpoint
that handles these notifications. The limitlion.throttle() call with a
rps=.5 using the default window of 5 seconds allows up to 3 notifications to
be processed every 5 seconds for each calendar. Anything beyond that is ignored.
@app.route('/calendar_update/<calendar_public_id>', methods=['POST'])
def event_update(calendar_public_id):
    request.environ['log_context']['calendar_public_id'] = calendar_public_id
    try:
        valid_public_id(calendar_public_id)
        allowed, tokens, sleep = limitlion.throttle(
            'gcal:{}'.format(calendar_public_id), rps=.5
        )
        if allowed:
            with global_session_scope() as db_session:
                calendar = db_session.query(Calendar) \
                    .filter(Calendar.public_id == calendar_public_id) \
                    .one()
                calendar.handle_gpush_notification()
                db_session.commit()
        return resp(200)
    except ValueError:
        raise InputError('Invalid public ID')
    except NoResultFound:
        raise NotFoundError("Couldn't find calendar `{0}`"
                            .format(calendar_public_id))
Governor
We have a re-indexing process that basically scans our Mongo database, and indexes documents into ElasticSearch. We need this process to run as fast as possible without overloading either data stores or impacting critical workloads. We really needed a way to throttle up/down based on the current infrastructure load.
As mentioned above, a throttle can have its knobs overridden by setting keys in Redis using this LimitLion method. This was initially useful for manually tuning a throttle, but it turns out we can go further. So, we implemented a Proportial-Integral-Derivative (PID) Controller we call the Governor that dynamically adjusts the RPS throttle knob, taking into account ES load, Mongo load, and the reindexer queue length. This solved a few problems:
- Automatically throttling up in the evenings and weekends when normal loads drop off
- Automatically throttling down
- When other higher priority workloads require compute resources
- When reindexing documents that are more difficult to index
Calibrating the Governor was quite a challenge (there are literally books written on the subject) but eventually we got everything working to the point we could trust it would throttle back before any issues were caused. We also added a circuit breaker that would quickly respond to high loads to catch edge cases where loads spike too fast for the PID to respond. Load metrics for Elasticsearch and Mongo come from Prometheus and are delayed by at least 15 seconds. This makes it very difficult for the PID to predict loads based on changes in the throttle and can result in some oscillation as it tries to “chase” the load. Even with these challenges we are happy with the outcome.
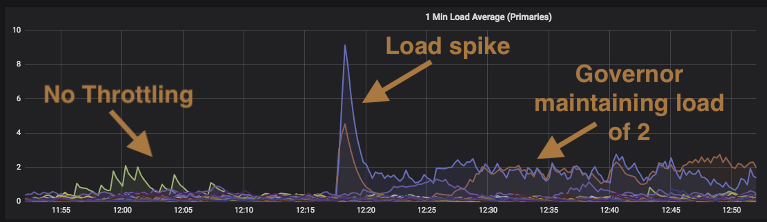
The following graph shows loads on our primary mongo instances during one of these reindexing operations. The Governor was configured to keep the Mongo instance loads at 2. Up to about 1217Z, the reindexing process is cruising along at its maximum allowed rate and causing almost no load on our Mongo cluster. But then as seen by the large spike at 1217Z the process transitioned from easy to index documents to very complex documents (e.g. email documents that have a single recipient versus emails that BCCed 1,000 recipients). The spike triggers the circuit breaker which quickly brings the loads down by setting the RPS to zero. At the 12:25 mark you can see the instance load indicated by the red line slowly come up to a load of about 2. The Governor then does a pretty good job managing the throttles and keeping the loads for the two instances at about 2 versus what we saw during the spike which would have been loads of 10+ if left unchecked.
Summary
Our rate limiting strategies continue to evolve as we get more experience tuning our workloads. LimitLion has made it easy to implement a throttle whenever we need to control a specific process. We have also started to categorize workloads into tiers which allows us to share throttles across similar workloads. LimitLion throttles have become a useful tool in our toolkit to help achieve equilibrium across our infrastructure.