
Finding the cause of a memory leak in Jest tests
As we’ve been increasing our test coverage using Jest and React Testing Library, we started seeing our CI-run tests occasionally failing with “out of memory” errors.
FATAL ERROR: Ineffective mark-compacts near heap limit Allocation failed - JavaScript heap out of memoryBut these happened only in the CI and only occasionally.
We’ve managed to fix the problem after a couple of hours, and we’d like to share the process of how we found the cause of a memory leak. Read on!
Running tests with heap usage recording
We tried increasing memory allocation to see if the tests just take too much memory, but in a steady manner. That did not work which showed us that we’ve got a memory leak in our tests.
When looking around for advice, we found an article about Jest memory leaks and went ahead and ran the following command:
node --expose-gc ./node_modules/.bin/jest --runInBand --logHeapUsageYou have to run the tests sequentially (--runInBand) and log heap usage
(--logHeapUsage).
Below is an excerpt of the run (file names mangled):
// …
PASS js/015.test.js (309 MB heap size)
PASS js/016.test.js (295 MB heap size)
PASS js/017.test.js (308 MB heap size)
PASS js/018.test.js (308 MB heap size)
PASS js/019.test.js (308 MB heap size)
PASS js/021.test.js (321 MB heap size) // memory usage starts increasing
PASS js/022.test.js (334 MB heap size)
PASS js/023.test.js (347 MB heap size)
PASS js/024.test.js (360 MB heap size)
PASS js/025.test.js (373 MB heap size)
PASS js/026.test.js (386 MB heap size)
PASS js/027.test.js (399 MB heap size)
PASS js/028.test.js (412 MB heap size)
PASS js/029.test.js (425 MB heap size)
PASS js/031.test.js (438 MB heap size)
// … a couple hundred more tests
At some point (with file 021.js) the memory usage started increasing by ~13MB
with each new test being run. Fun fact: if we re-ran the command, a
different test “marked” the start of memory leaking. That made it pretty hard
to pinpoint the problematic test file.
Debugging tests in Chrome
We went ahead and brought in Chrome to inspect the node process that runs the tests:
node --inspect-brk --expose-gc ./node_modules/.bin/jest --runInBand --logHeapUsageThen go to Chrome -> enter chrome://inspect and connect the debugger.
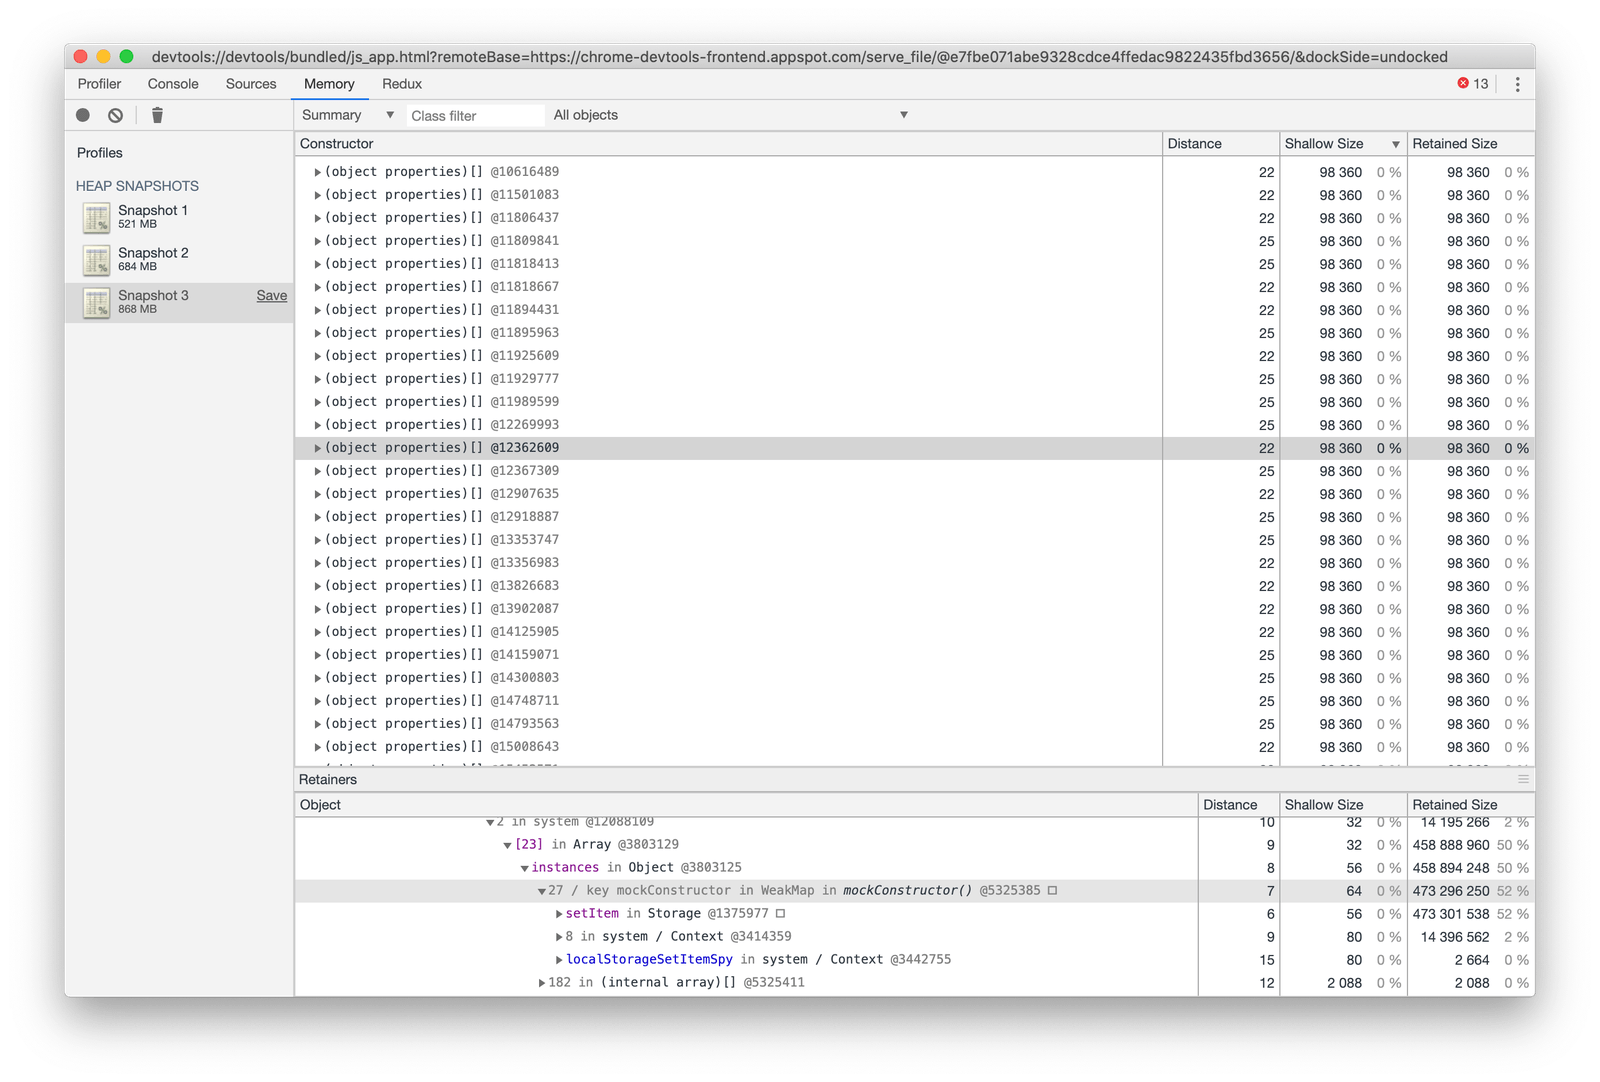
We took 3 heap snapshots, compared what was increasing disproportionately (array constructor) and dug deeper.
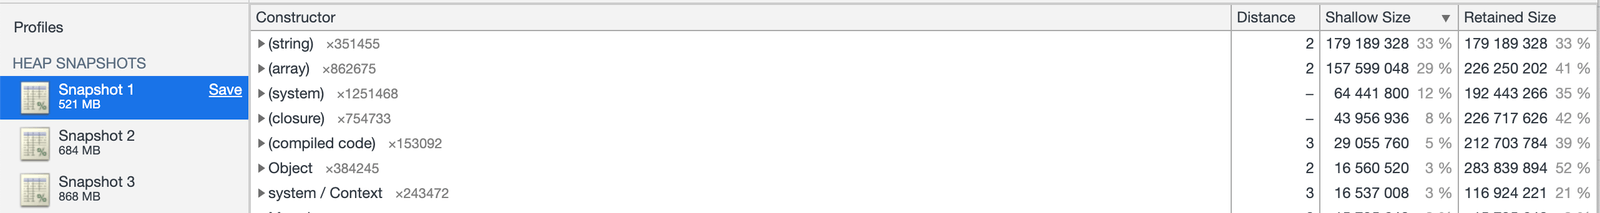
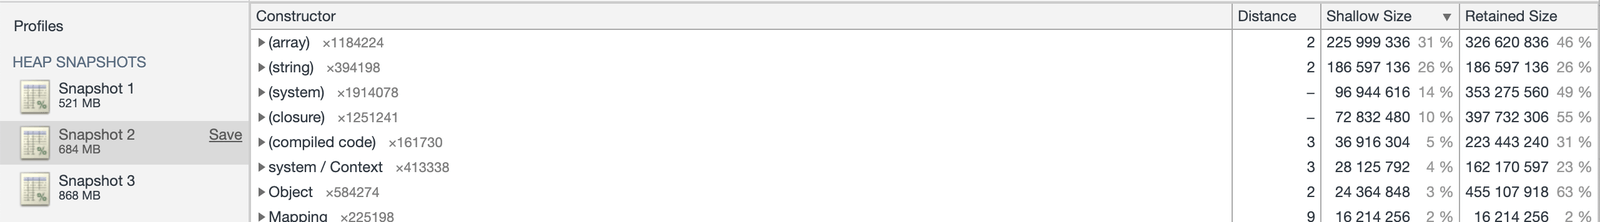
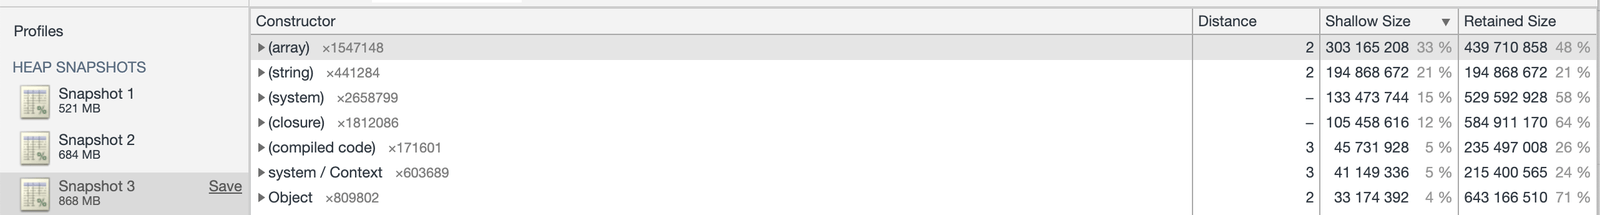
There was a series of same-memory-allocation blocks (see the Shallow Size
column in the screenshot below) that was growing for each snapshot. We drilled
into those blocks and found traces of localStorage and its mocking. The
localStorageSetItemSpy in the screenshot below looked like something we
wrote.
The root cause & solution
We found a couple of test files referencing localStorageSetItemSpy. In one of
those files, there was a missing
.mockRestore
call (note that
.mockReset only
resets call counts etc.):
// …

let localStorageSetItemSpy;

beforeEach(() => {
  // …
  localStorageSetItemSpy = jest
    .spyOn(Storage.prototype, 'setItem')
    .mockImplementation(() => {});
  localStorage.clear();
});

afterEach(() => {
  localStorageSetItemSpy.mockReset();
});
// …
To fix the memory leak, we had to add an
afterAll block that
restored the mock:
afterAll(() => {
  localStorageSetItemSpy.mockRestore();
});
We suspect this mock was carried over to other tests as it was touching on a global object's prototype.
Closing thoughts
Memory leaks can be nasty and pretty hard to find. We found that the hard way. We should always make sure to clean up after ourselves in our tests when mocking, even though Jest runs each test file in a separate process.
We hope the process for finding the cause of a memory leak outlined in this article will help you fix similar issues in your projects.