
Faster CI with Orchestrated Pytest Workers


Here at Close, our primary backend service has automated tests. Quite a lot of them, nearly 58,000. While some things are easy to test in pure Python, the tests that actually give us the most confidence generally are API or service-level integration tests that avoid mocking and typically do actually hit datastores.
How long do all 58,000 integration tests take to run in CI?
About 2 and a half minutes.
Yes, 58,000 integration tests, most of which do IO across multiple datastores, in under 3 minutes.
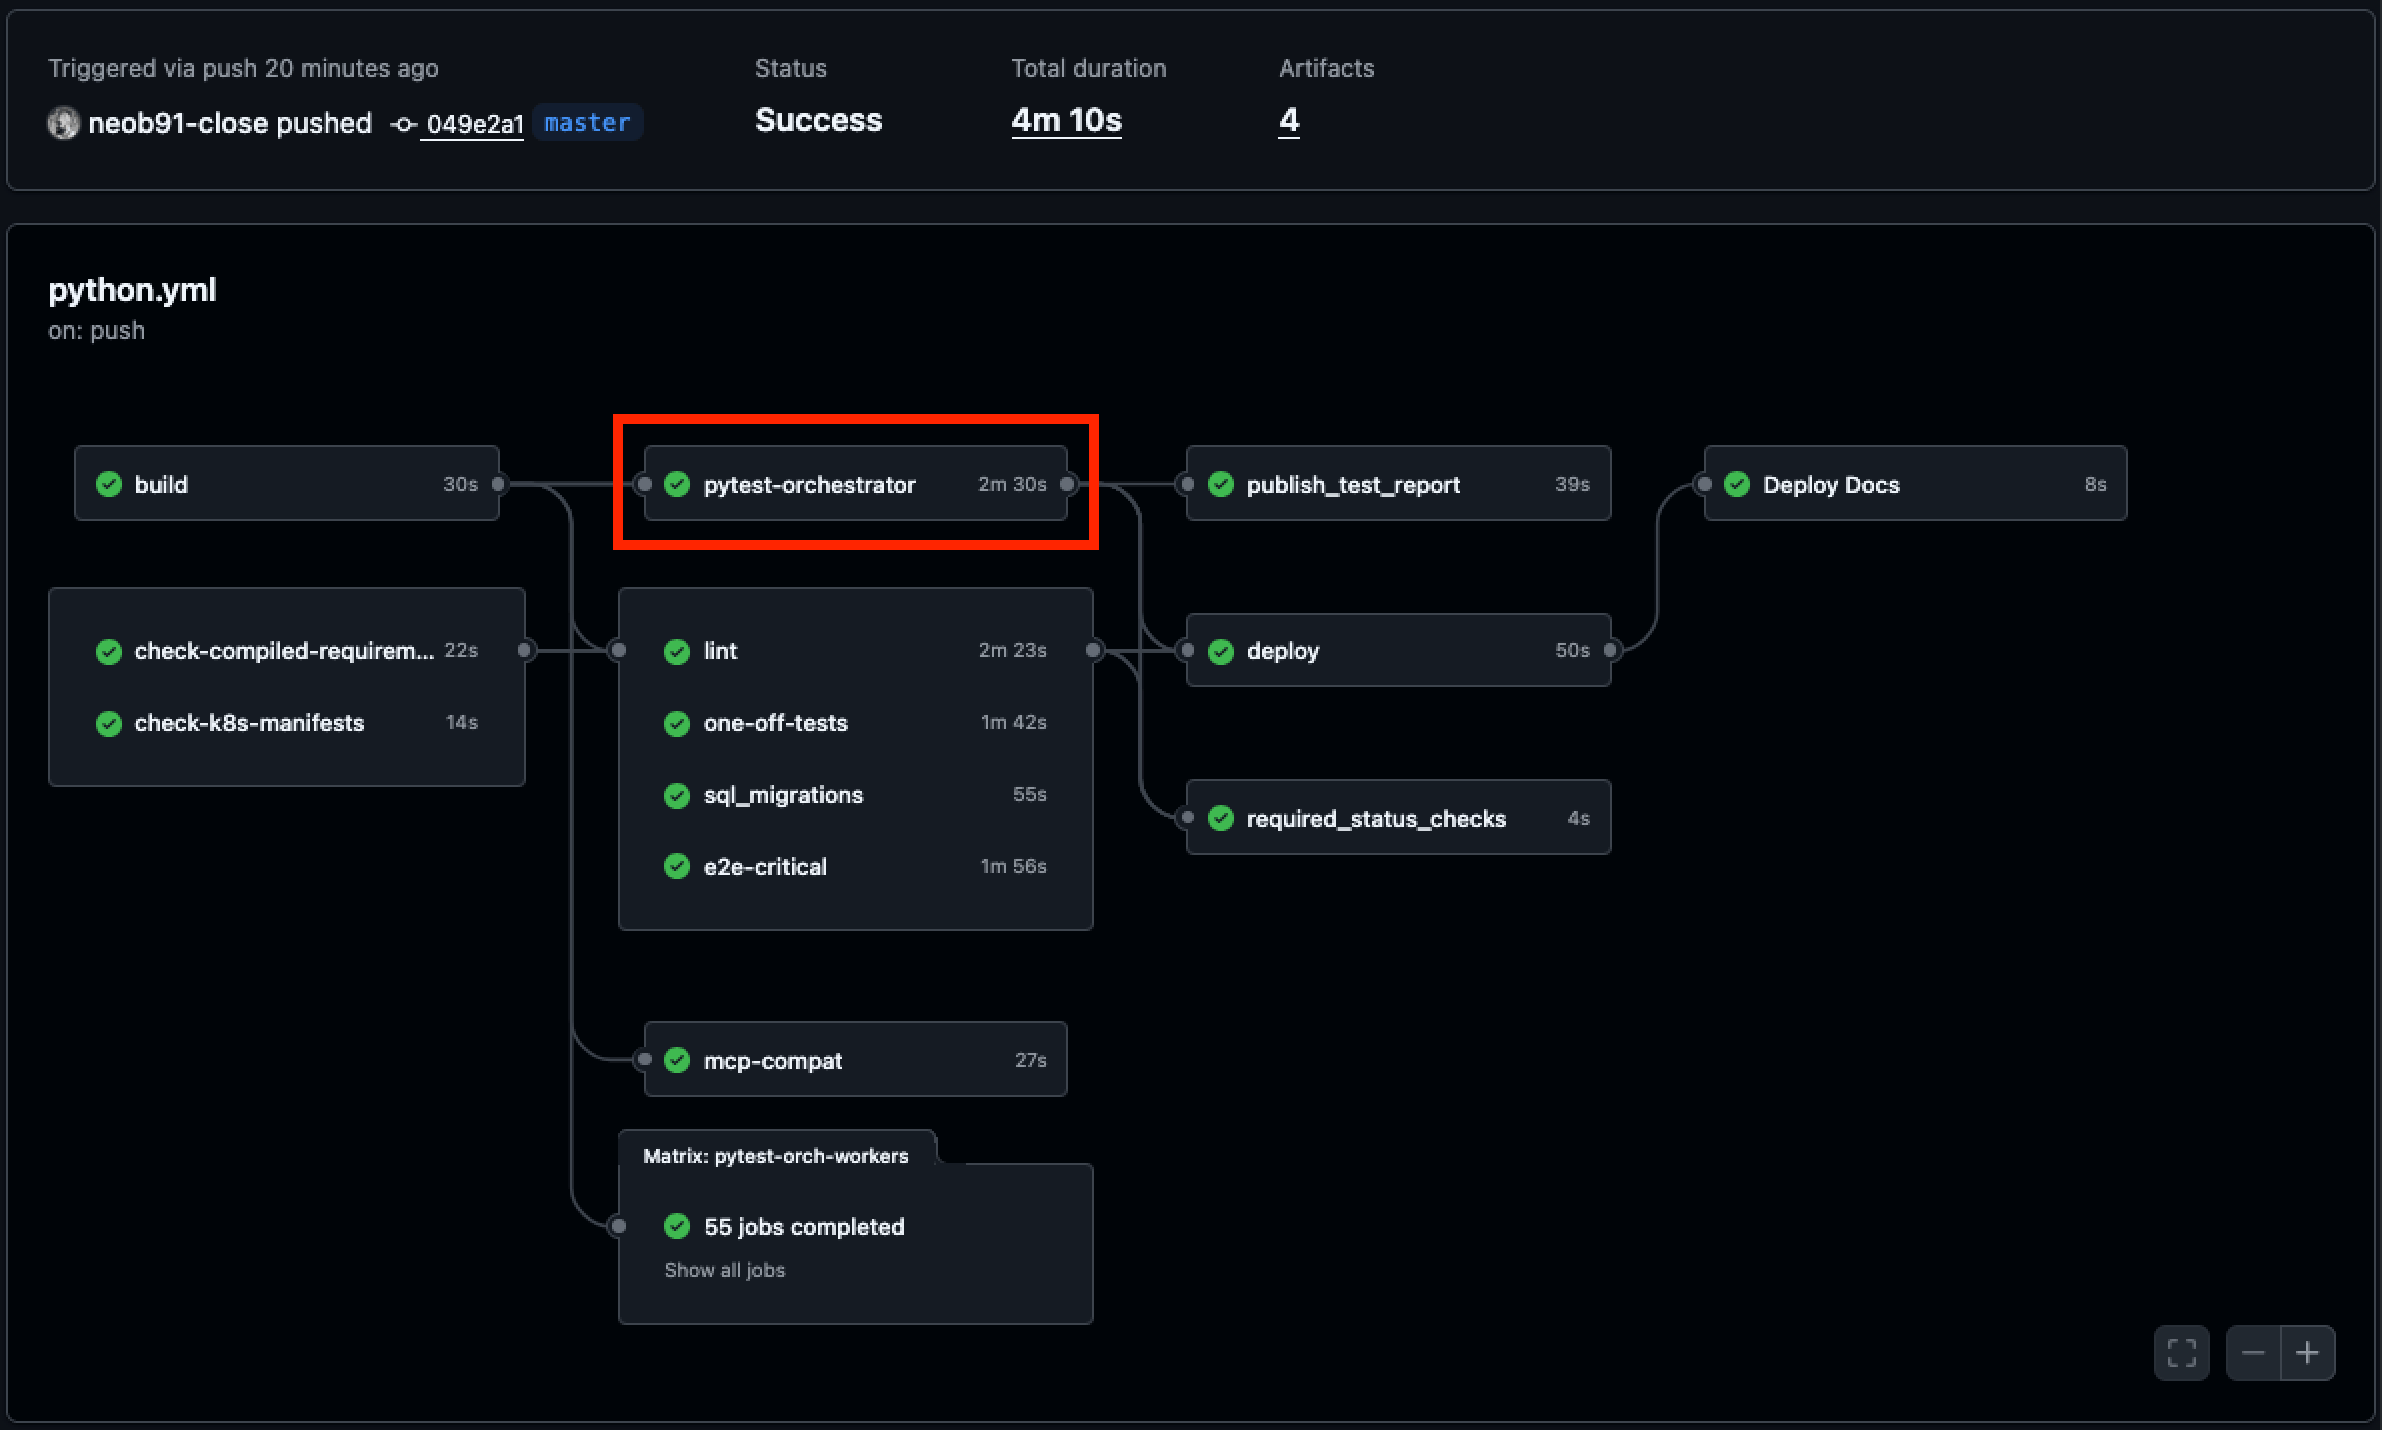
How? Let's go on a journey together...
Learning to Crawl...
Close launched in 2013, but our test suite is actually even older! Tests in CI were introduced in 2012, with a Jenkins build script and the nose testing library. We've since migrated to CircleCI then GitHub Actions, swapping to pytest along the way. But a lot of the same concepts are still relevant today. The general shape of a test run is:
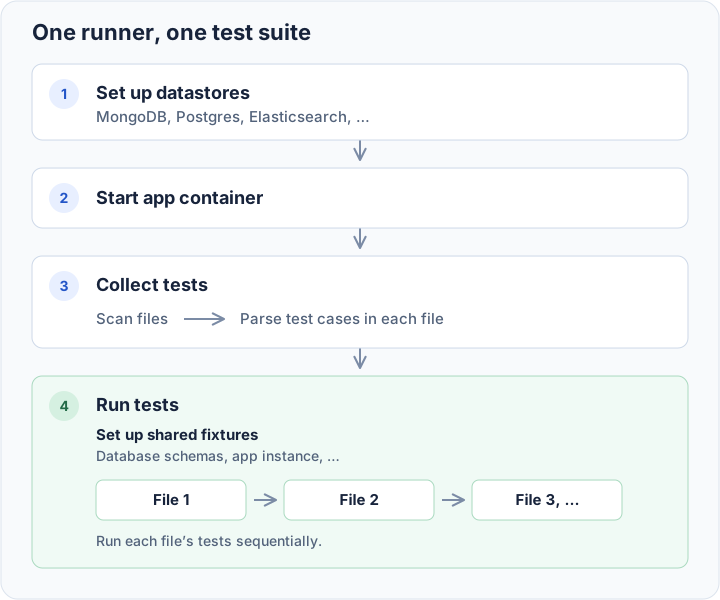
For simple applications with only a handful of tests, this setup works great! But as the application starts growing, slowly the "run tests" step inflates to the point where you start waiting tens of minutes for a green checkmark to appear. While working on features you're subject to intrusive voices of gremlins whispering "but what if it was faster? Surely it could go faster"
Crawl to Walk...
The natural next step is... parallelism! There's a few common ways to do this,
but the most straightforward options are either multiprocessing parallelism
(something like pytest-xdist)
that fans out work across multiple CPUs, or deterministically splitting work
across multiple machines (something like pytest-split).
Multi-CPU parallelism doesn't really help us, because most of our tests rely on external databases. Running multiple tests at the same time on the same database can lead to logical conflicts where tests end up reading each other's data. While it's possible to configure things like dynamic database creation, practically it's both hard to do correctly across many datastores and is even harder to do performantly.
Deterministic work splitting was a much more attractive option for us, since many
CI providers started offering matrix'd builds where you could easily specify
different parameters for each of them (i.e. run the pytest with parallelism
of 4, where each runner knows which number it is). This strategy just added a
little bit of CI configuration, but ultimately only required installing a plugin
and adding a few flags to the CI command. Today it would look something like:
pytest --splits 4 --group 1Some version of this logic has been relatively easy to set up for a long time, and we introduced it to Close in late 2014. With this version of test splitting, our full test run now looks like:
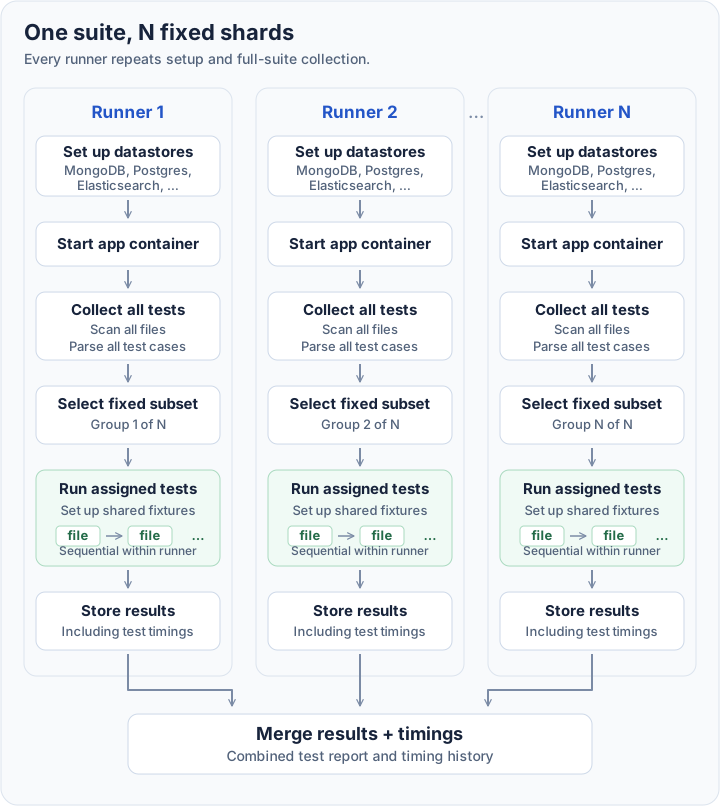
Walk to Run...
Early versions of test splitting logic relied on file names to split tests up, leading to unbalanced workloads. Eventually we were able to tweak the splitting logic a bit, so that we tracked main-branch test timings and bin packed them instead of splitting pseudo-randomly.
And this rough setup actually lasted us about 12 years! Over this time we didn't ignore CI speed, but we were mostly able to improve it through relatively minor / incremental changes:
- refactor unittest-style tests to pytest
- refactor pytest fixtures to make it easier to rely only on what the test needs
- architecturally refactor to avoid global state and avoid API overhead when testing edge cases
- keep global imports out of shared fixtures
- avoid pytest assertion rewrites in ci
- increase the level of parallelization (number of runners)
- upgrade Github Actions runner node instance types
But ultimately we hit a wall. The gremlins continued whispering, but there was no low-hanging fruit left. For a long time we were able to stabilize our test suite under around 10 minutes, but eventually even at 17x parallelization our CI times grew longer. The fixed-cost steps became very hard to optimize and scale out of.
What do you mean, "fixed cost"?
Well, the part of the test run that pytest-split parallelizes is actually
running the test cases. When the application gets big enough, just running
things like test collection could take up to a minute to resolve. It's not
technically "fixed" cost, but these operations scale with the size of the entire
app/test suite rather than just the selected test subset. So even as
we scale up the number of runners, a lot of our runtime still goes
to an ever-growing setup cost:
- pulling images and starting datastores could take a minute
- the app container couldn't start until datastores were ready
- test collection couldn't start until the app container was ready
- test collection always needed to collect the full suite before it could deterministically split (which took over a minute even without pytest's assertion rewriting enabled)
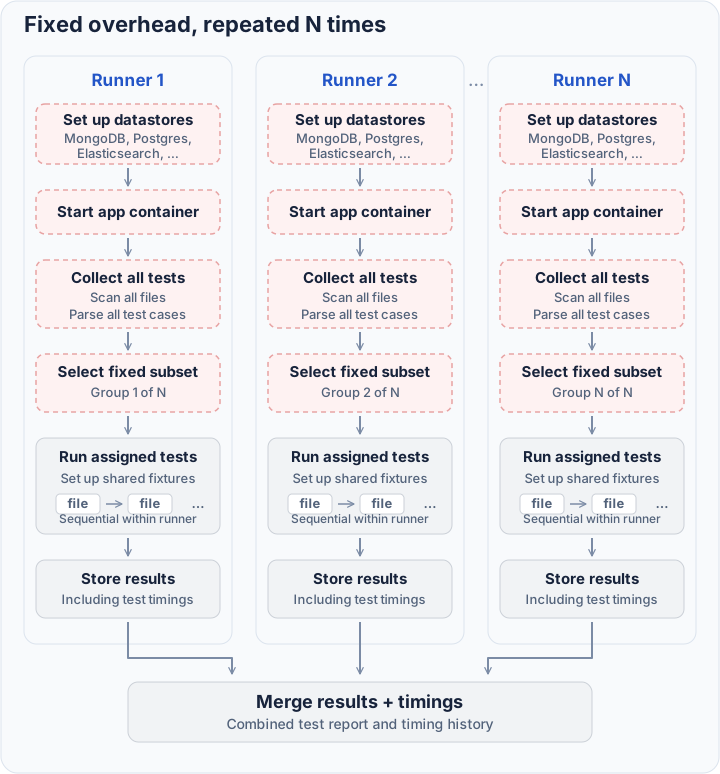
Despite our best efforts, the best performance we could get out of this
setup was around 12 minutes of wall clock runtime. About half of that was eaten
up by either fixed-cost steps, or by imperfect test balancing that resulted in
some runners taking multiple minutes longer than others. We're already
self-hosting our GitHub Actions runners to squeeze better performance out of
them, but at some point you have diminishing returns turning the N knob
higher. And that's just for tests! There's also unparallelizable build and
deploy steps that continued to add up end to end runtime.
Run to ... Fly?
So where do we go from here? Well... while looking at something related to our end to end Playwright tests, I stumbled across currents.dev.
What currents.dev does for Playwright is that they maintain a centralized
queue of work and tweak the test runner logic to consume from that queue instead
of from a deterministic -split of work. They present two major unlocks:
-
Smart Orchestration: Work is split dynamically so workloads are always split evenly
-
Spot instance support: If a worker's node gets yoinked by AWS, its work gets redistributed
Those features are really neat, but there's also a more subtle opportunity this architecture unlocks:
We can much more effectively parallelize our fixed-cost setup steps.
What if we applied these concepts to pytest? Let's visualize how a shared orchestrator changes our testing setup:
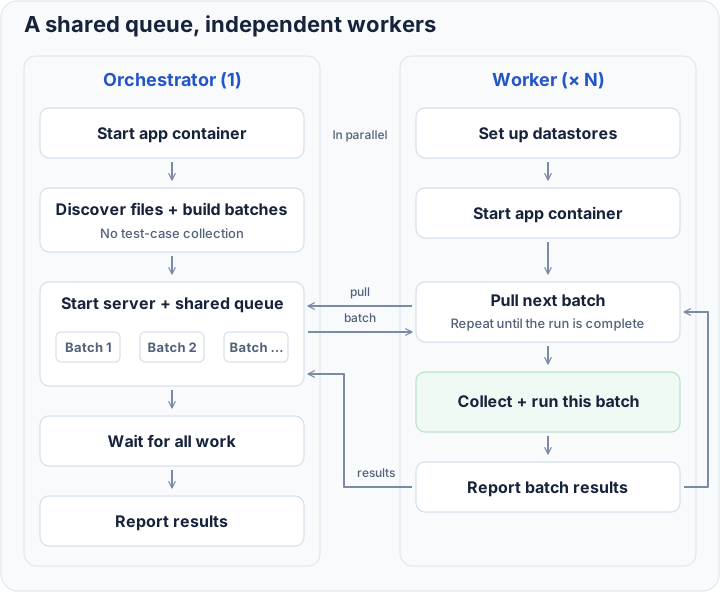
A few things worth calling out:
- The orchestrator doesn't need to run datastores at all
- The orchestrator only needs to collect files, which allows us to skip a huge portion of pytest's collection runtime
- Workers only collect what they run, which means their collection runtime scales down to their workload
- The orchestrator can collect and split tests in parallel to workers starting their backends
So now we're running one extra job (to orchestrate), but virtually all of our test workers' steps scale in runtime with the number of tests they're asked to run. What's next?
Spot instances.
Actually implementing spot instance support in GitHub Actions was hairy enough
to deserve its own post, so we'll have to leave it on a cliffhanger for now. But
with the amount of savings they offer, we were able to turn 17 on-demand runners
into 2 on-demand runners + 54 spot instances for about the same dollar cost. That's
one orchestrator and on-demand worker (for yoink insurance), plus 54 spot
instance workers. We did end up keeping main on-demand though to keep it
predictable.
With that type of parallelism and our improved scaling mechanism, our CI speed is good enough ... for now.
The devil's in the details
If you're trying to reproduce this type of setup, here's a bit more detail to help.
How do the workers talk to the orchestrator?
Even with self-hosted runners, workers need some way to communicate back to
the orchestrator server. But GitHub Actions runners aren't externally
addressable. We worked around this by having the pytest-orchestrator CI step
work more like a k8s operator that creates a temporary, deterministically
named namespace / pod in the same CI/CD Kubernetes cluster.
Each worker knows what namespace to look for based on run-specific identifiers, and has a connection grace period where it waits for them to come up.
Rerun on Failure
With a pytest-split type of setup, rerunning just a subset of workers would
rerun the same subset of tests. Now that tests are distributed dynamically, it's
not trivial to rerun just the failing tests. If only one worker fails, rerunning
failed jobs essentially amounts to running the full test suite with just a
single worker. Slow.
Instead of always rerunning all jobs, we've set each worker to wait until all batches are finished, then let the orchestrator decide if the run was clean or not. If it wasn't, then all workers fail. All test failures / stack traces show up in the orchestrator's outputs, so you don't need to inspect every individual worker for failures. But now since they all fail, rerunning failed jobs starts up the right number of workers for the test suite.
Speeding up test collection
To avoid drift between pytest config and CI logic, we've opted to keep pytest
responsible for test collection (as opposed to basic file globbing
tests/**/*.py). The plugin only activates if explicitly enabled, and
if no other collection-related args are passed (e.g. -k, -m, --lf, etc).
While collecting, it skips descending into files and writes out discovered files
to a given location as JSON.
Balancing Batches
Initially we noticed that some runners still took noticeably longer than others, even though we aimed for batches of 20s of test runtime. It turned out to be a subtle issue with a simple fix: not all files themselves fit into that 20s target, and during batching we ended up with a somewhat random batch ordering. So, often an oversized batch would be the last one for a worker to claim and everything else would just wait on it. The fix was to sort batches in descending order before assigning them out. That way towards the end we have slightly better bin packing / runtime distribution.
Scaling Our Self-Hosted GitHub Actions Runners
Just because we now request dozens of workers all at the same time doesn't mean we actually get them. When looking at CI runs, it's not always obvious how long was spent waiting in a queue for a runner to come up, and with this type of coordinated workload it can make a big difference in end to end runtime.
We bumped our idle runner count and had to scale the max node pool sizing to better account for bursty demand during the day.
Measuring CI Timings
The GitHub Actions UI can be very misleading about how long something actually took to run. The timings of each step don't well communicate how long it took a job to start, and how long in wall-clock time it fully took end to end. And it's really hard to get a true sense of this in aggregate if you can only look at cherry picked CI runs.
Our CI setup has a post-action job that for every CI run inspects the step timings and converts it into trace data. That trace data then feeds into our OTel stack, making it easy to aggregate and report on with ClickHouse in Grafana. We end up with nice aggregate stats, and can drill down into specific jobs if needed:
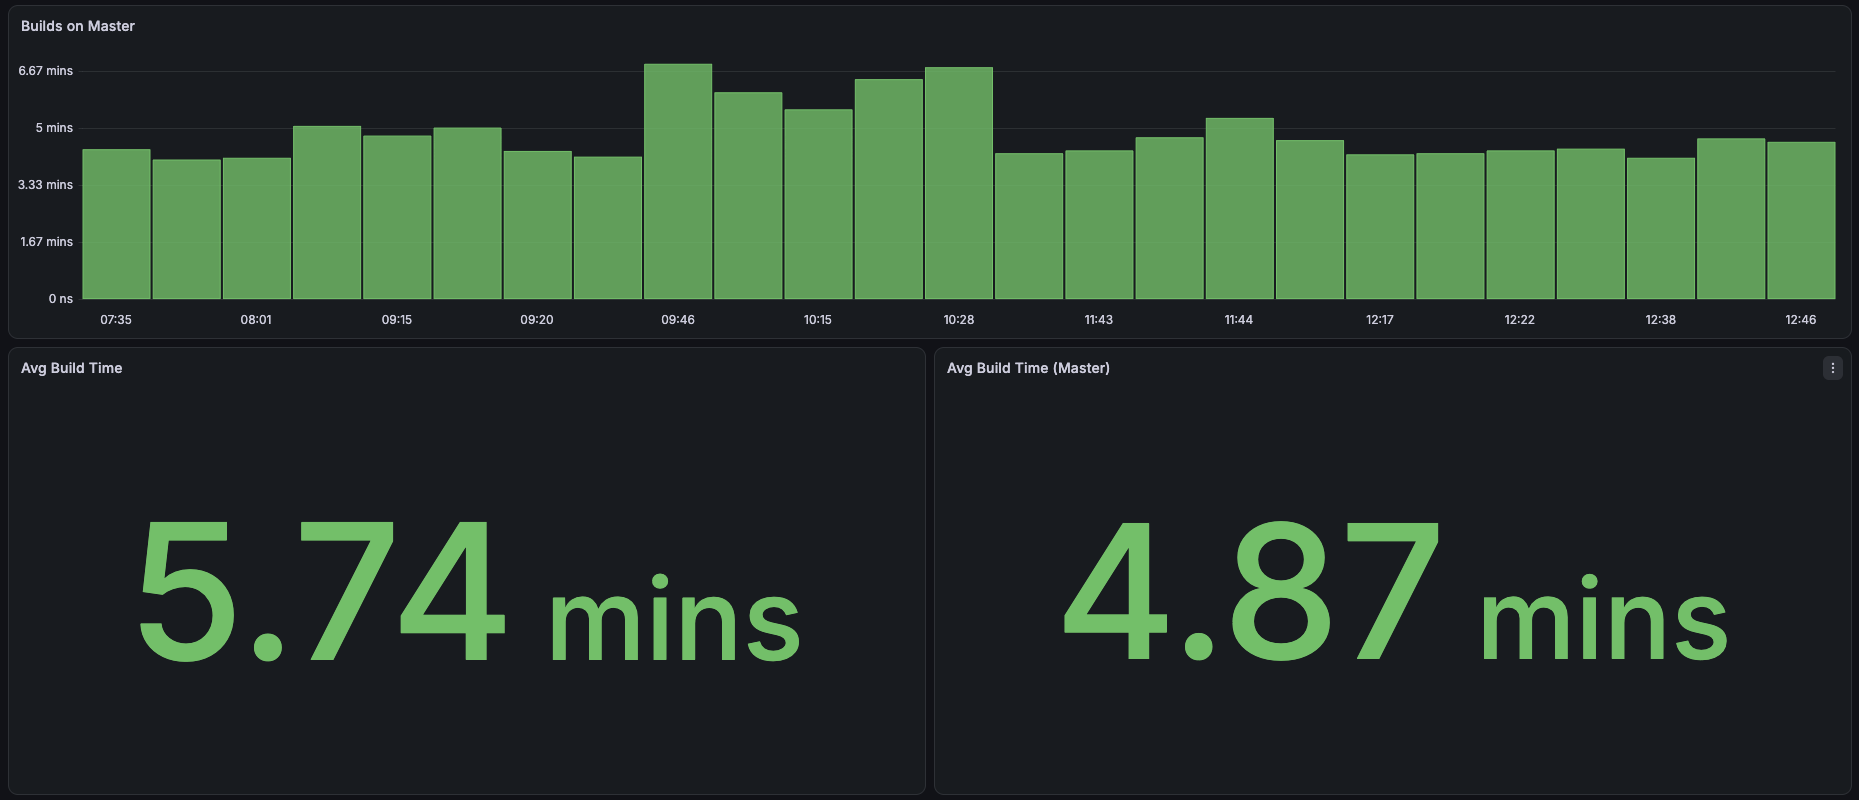
Note: Average build time here includes all actions queueing, uncached image builds from dependency bumps, deploy, and post-deploy steps. It also reflects GitHub Actions degradations.